Your Grafana Cloud k6 test results provide a comprehensive overview of your application performance trends, which can help you detect patterns and uncover performance issues.
You can export your test results in two formats:
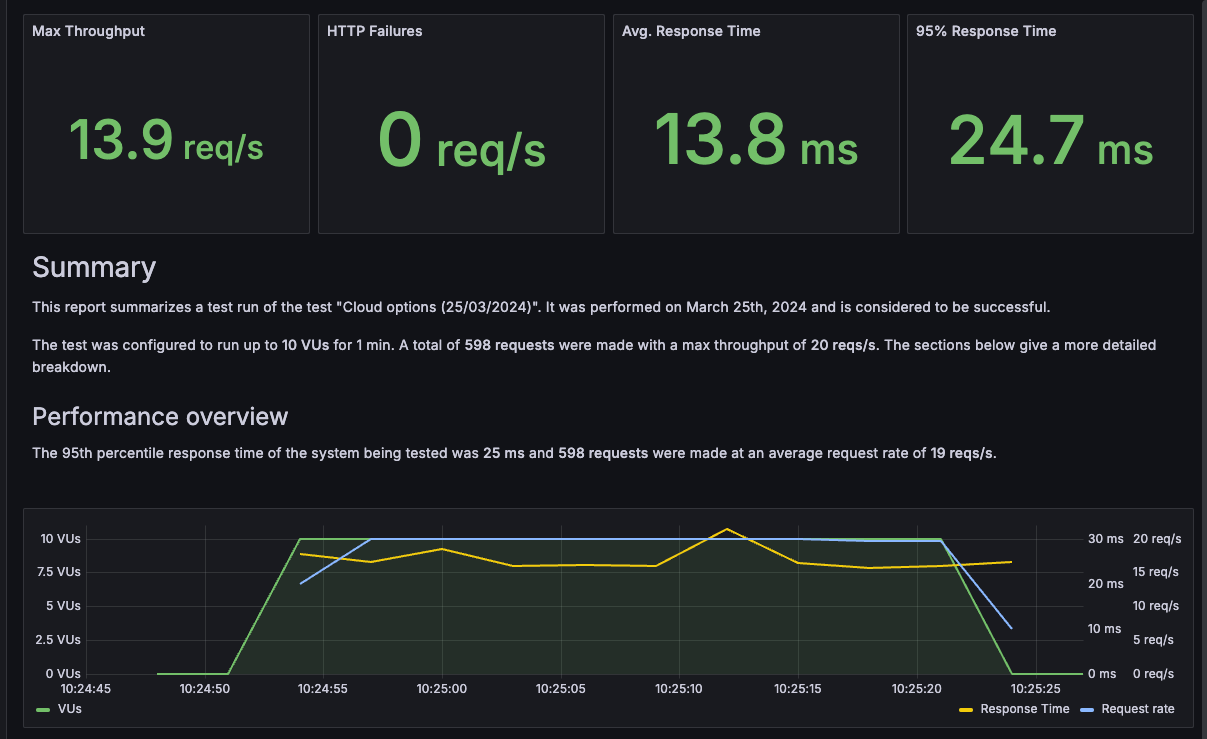
You can export your test results as a dashboard to track and share your data with other team members. The exported dashboard serves as an executive summary of the test results’ most relevant metrics and performance data.
To export a summary:
This action opens a dialog box where you can choose a name and destination for the summary and customize its layout.
Note
You can only see this step if you have the dashboards:write permission.
Creating folders also requires the folders:create permission. If you don’t have permission to create folders, the option to create one won’t appear.
Under Folder, you can select the folder where your dashboard should be created.
You can also create a folder by selecting the Folder field, typing in the new folder name, and selecting Create in a new folder called.
The editor includes several sections that you can include or exclude from your summary. Each section represents a time series graph for that metric over the test run time.
To customize the data included in the summary:
Summaries can contain HTTP and browser results. Different options are available depending on the data available in your test run.
If your test has HTTP data, the sections include:
| Option | Description |
|---|---|
| Enabled | Include HTTP results in the summary. |
| Response time | The response time in different percentiles. |
| Throughput | The request rate. |
| Bandwidth | The amount of data sent and received. |
If your test has browser data, the sections include:
| Option | Description |
|---|---|
| Enabled | Include browser results in the summary. |
| Loading | Web Vitals affecting the perceived load speed. |
| Interactivity | Web Vitals affecting user interactions. |
| Rendering | Web Vitals affecting the rendering performance and stability. |
You can find additional options under Options.
| Option | Description |
|---|---|
| Include scenarios | Add charts for each scenario in the test results. |
| Include load zones | Add sections summarizing the test results for each load zone. |
After generating the summary dashboard, you can edit and share it like any other dashboard.
For instance, you can share the summary as a PDF by using the PDF export feature in Grafana.
To export a test result as a CSV file:
Depending on your test result, the CSV export might take some time. You can:
The exported data you can download is a ZIP file that contains a number of CSV files.
Each metric, such as VUs and HTTP requests, has its own separate file. The export also contains a metrics.csv file with the list of exported metrics.
A typical k6 HTTP test includes the following files:
| File name | Metric | Columns |
|---|---|---|
| metrics.csv | Index of exported metrics | metric , type , origin |
| metric_checks.csv | checks | time , metric , scenario , group , check , load_zone , tags , nz_count , count |
| metric_data_received.csv | data_received | time , metric , scenario , group , load_zone , tags , count |
| metric_data_sent.csv | data_sent | time , metric , scenario , group , load_zone , tags , count |
| metric_group_duration.csv | group_duration | time , metric , scenario , group , load_zone , tags , count , min , mean , median , p95 , p99 , max , stdev |
| metric_http_reqs.csv | http_reqs | time , metric , group , scenario , name , method , status , expected_response , load_zone , tags , count |
| metric_http_req_duration.csv | http_req_duration | time , metric , group , scenario , name , method , status , expected_response , load_zone , tags , count , min , mean , median , p95 , p99 , max , stdev |
| metric_iteration_duration.csv | iteration_duration | time , metric , scenario , group , load_zone , tags , count , min , mean , median , p95 , p99 , max , stdev |
| metric_iterations.csv | iterations | time , metric , scenario , group , load_zone , tags , count |
| metric_load_generator_ cpu_percent.csv | load_generator_cpu_percent | time , metric , scenario , group , load_zone , tags , count , min , mean , max , last |
| metric_load_generator_ file_handles.csv | load_generator_file_handles | time , metric , scenario , group , load_zone , tags , count , min , mean , max , last |
| metric_load_generator_ memory_used_percent.csv | load_generator_memory_used_percent | time , metric , scenario , group , load_zone , tags , count , min , mean , max , last |
| metric_vus.csv | vus | time , metric , scenario , group , load_zone , tags , count , min , mean , max , last |
| metric_vus_max.csv | vus_max | time , metric , scenario , group , load_zone , tags , count , min , mean , max , last |
| metric_myCustomCounter.csv | User-defined myCustomCounter Counter | time , metric , scenario , group , load_zone , tags , count |
| metric_myCustomGauge.csv | User-defined myCustomGauge Gauge | time , metric , scenario , group , load_zone , tags , count , min , mean , max , last |
| metric_myCustomRate.csv | User-defined myCustomRate Rate | time , metric , scenario , group , load_zone , tags , nz_count , count |
| metric_myCustomTrend.csv | User-defined myCustomTrend Trend | time , metric , scenario , group , load_zone , tags , count , min , mean , median , p95 , p99 , max , stdev |
The following table is a reference for the columns in the CSV data, with examples, data types, and descriptions.
| Column | Example | Type (unit) | Description |
|---|---|---|---|
| time | 2019-03-25 11:12:48.927949+00:00 | datetime (UTC) | The ISO-8601 timestamp when this data point was captured (when the HTTP request was made). |
| metric | http_req_duration | string | The metric name that this data point represents. |
| group | “my group” | string | The group name group() from where this request was made. |
| scenario | default | string | The name of the scenario that this metric was collected in. |
| url | http://test.k6.io/style.css | string | The URL requested. |
| method | GET | string | The HTTP method of the request that this data point represents. |
| status | 200 | number | The HTTP response status code of the request that this data point represents. |
| count | 1.0 | number | Number of samples that this data point represents (if > 1 response_time is an aggregate value). |
| load_zone | amazon:us:ashburn | string | The load zone where the requests were sent from. |
| tags | string | JSON formatted list of tags as specified for the request in the script. | |
| min | 1.008016 | number (ms) | The minimum response time for samples collected within the time bucket. |
| mean | 3.008016 | number (ms) | The mean response time for samples collected within the time bucket. |
| median | 5.468016 | number (ms) | The median response time for samples collected within the time bucket. |
| p95 | 10.10816 | number (ms) | The 95th percentile response time for samples collected within the time bucket. |
| p99 | 14.08016 | number (ms) | The 99th percentile response time for samples collected within the time bucket. |
| max | 15.08016 | number (ms) | The maximum response time for samples collected within the time bucket. |
| stdev | 0.075112 | number (ms) | The standard deviation time for samples collected within the time bucket. |