The SAT score have been increased 37.5 points since 2014 and it has risen steadily in recent years at TROY. Compared to previous year, the SAT score increased by 5 points at TROY. Compared to similar schools, the submitted SAT and ACT scores are around national average at TROY.
You can check and compare colleges with similar SAT scores TROY by SAT score range 950-1050, 1000-1100, and 1050-1150.
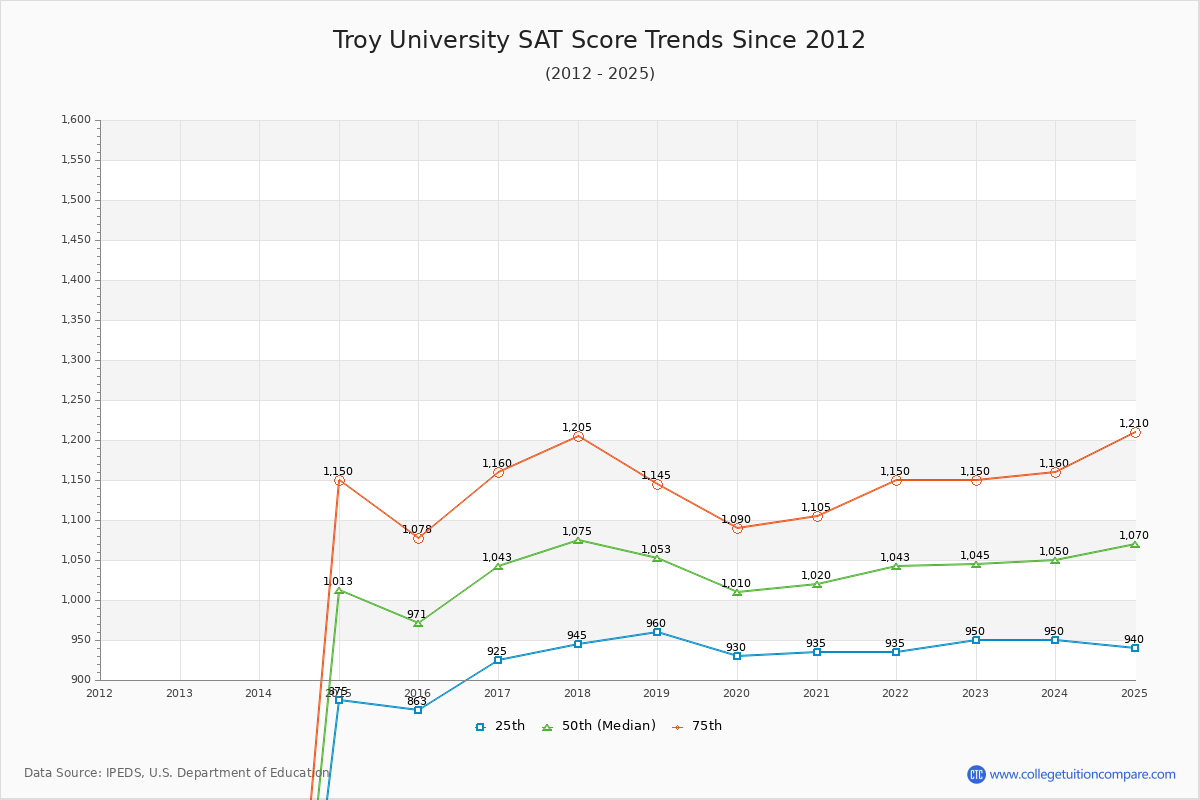
The 2024 SAT score is 1050 at TROY. Over the past 11 years, the average SAT score is 927 (25 th percentile) and 1139 (75 th percentile). Compared to similar schools, the submitted SAT scores are around national average at TROY.
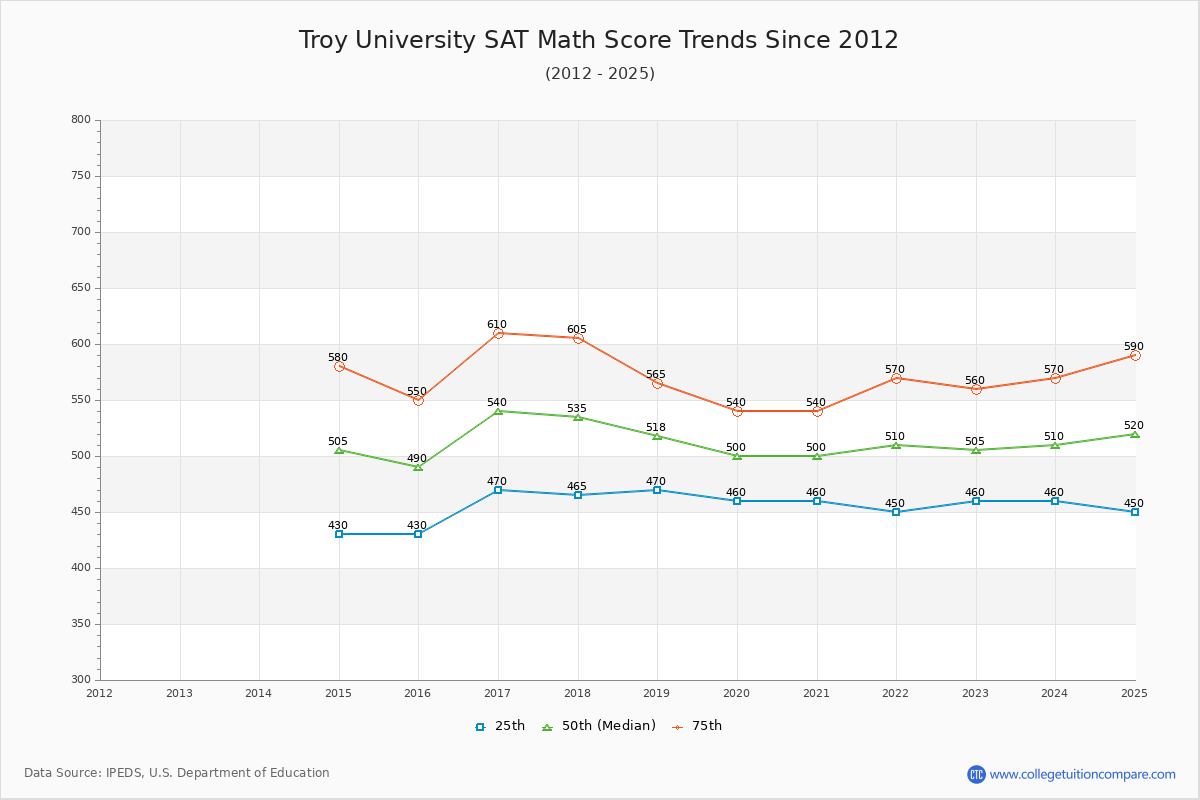
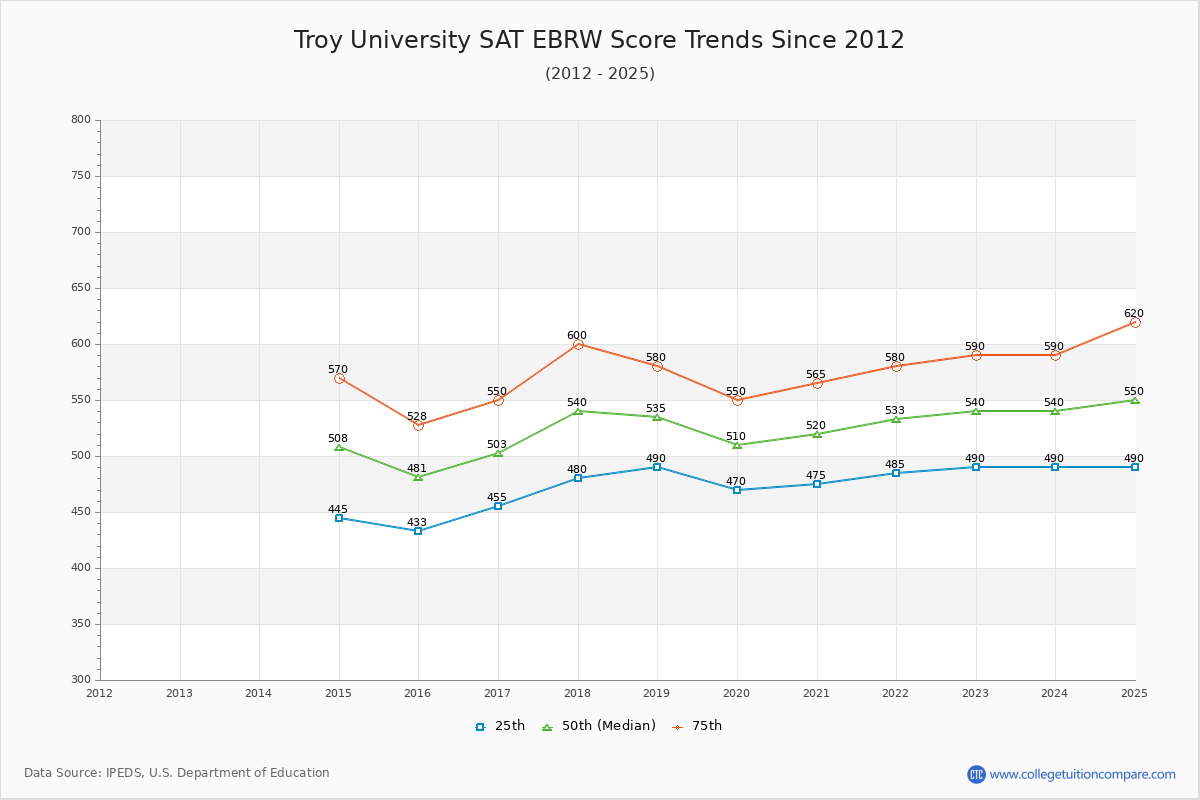
The following table and chart illustrate the changes in SAT scores at Troy University since 2014.
| Year | Total | Math | Evidence-Based Reading and Writing | ||||||
|---|---|---|---|---|---|---|---|---|---|
| 25 th | 50 th | 75 th | 25 th | 50 th | 75 th | 25 th | 50 th | 75 th | |
| 2014-15 | 875 | 1,013 | 1,150 | 430 | 505 | 580 | 445 | 508 | 570 |
| 2015-16 | 863 | 971 | 1,078 | 430 | 490 | 550 | 433 | 481 | 528 |
| 2016-17 | 925 | 1,043 | 1,160 | 470 | 540 | 610 | 455 | 503 | 550 |
| 2017-18 | 945 | 1,075 | 1,205 | 465 | 535 | 605 | 480 | 540 | 600 |
| 2018-19 | 960 | 1,053 | 1,145 | 470 | 518 | 565 | 490 | 535 | 580 |
| 2019-20 | 930 | 1,010 | 1,090 | 460 | 500 | 540 | 470 | 510 | 550 |
| 2020-21 | 935 | 1,020 | 1,105 | 460 | 500 | 540 | 475 | 520 | 565 |
| 2021-22 | 935 | 1,043 | 1,150 | 450 | 510 | 570 | 485 | 533 | 580 |
| 2022-23 | 950 | 1,045 | 1,150 | 460 | 505 | 560 | 490 | 540 | 590 |
| 2023-24 | 950 | 1,050 | 1,160 | 460 | 510 | 570 | 490 | 540 | 590 |
| Average | 927 | 1032 | 1139 | 456 | 511 | 569 | 471 | 521 | 570 |
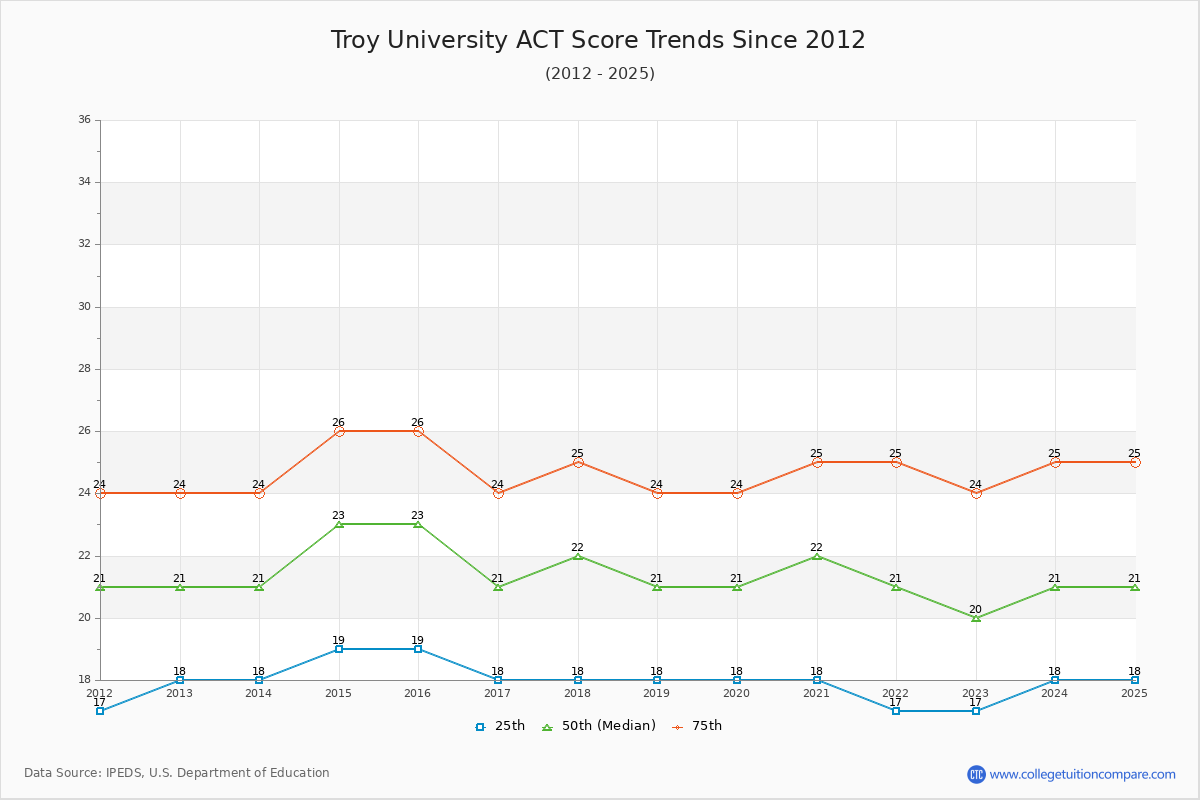
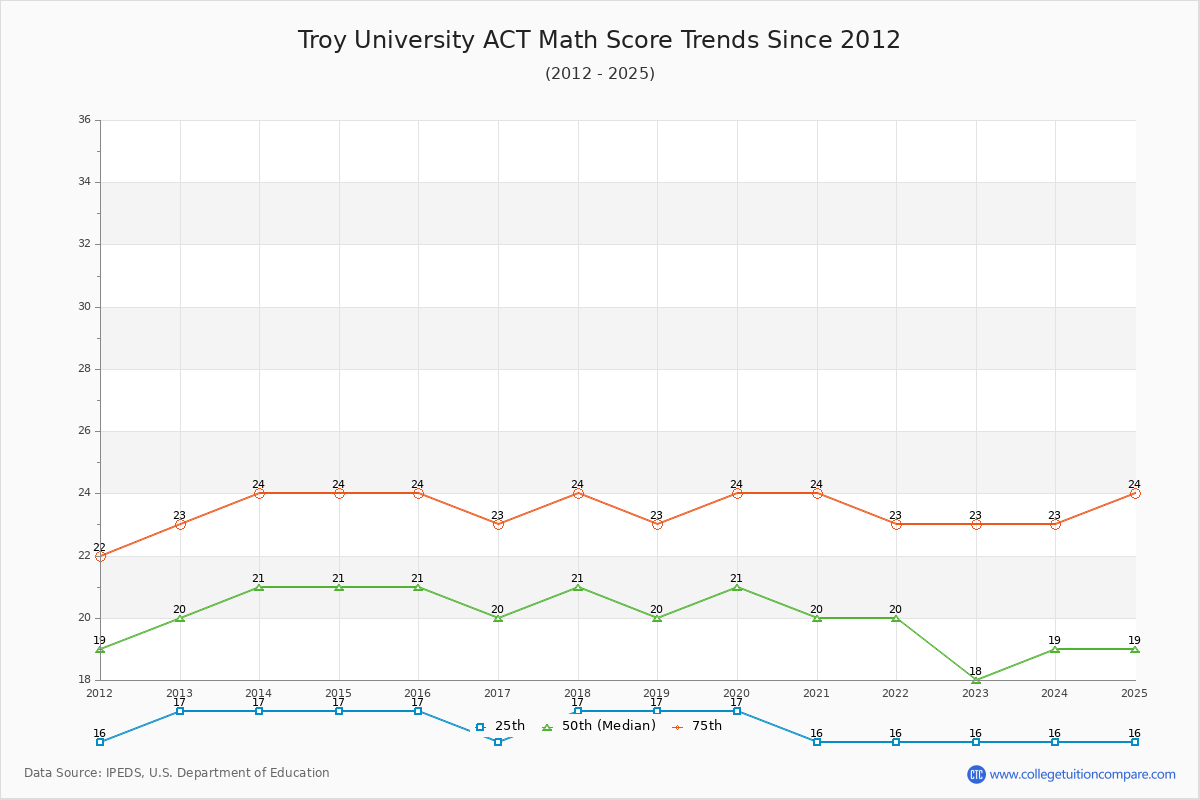
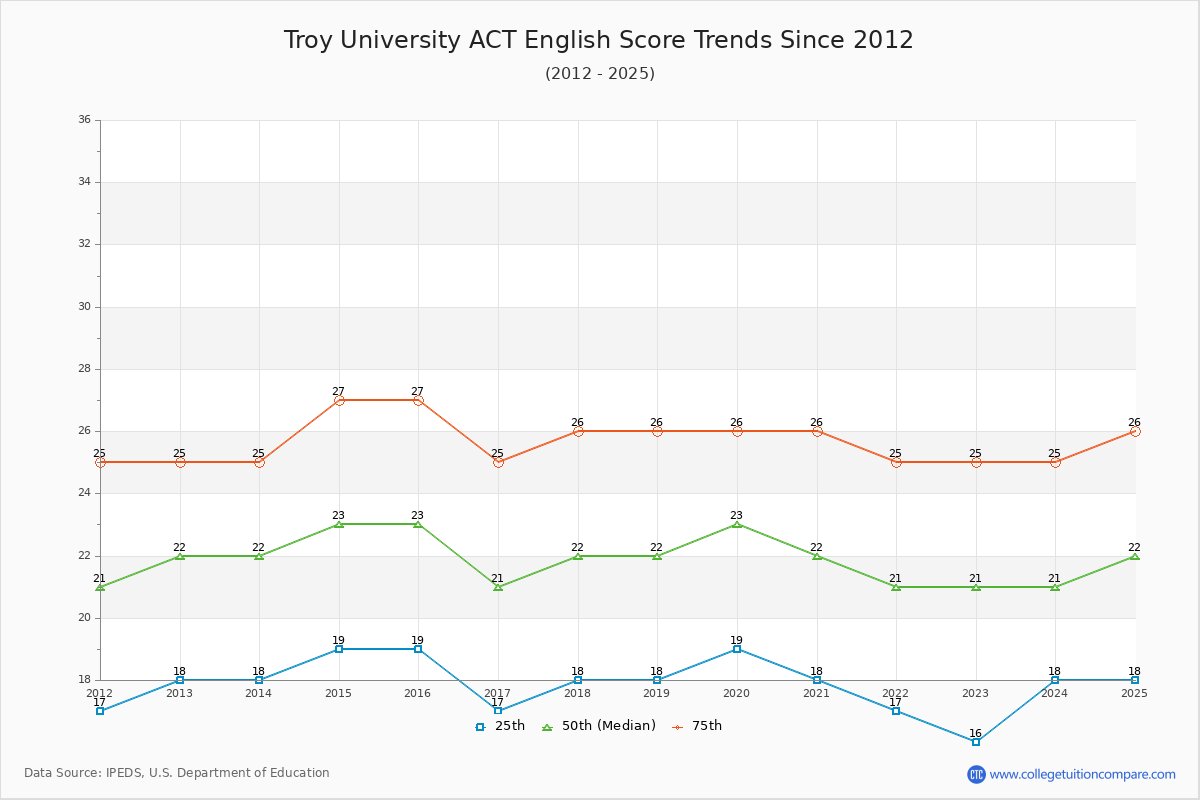
The 2024 ACT score is 21 at TROY. Over the past 11 years, the average ACT score of the last 11 years is 18 (25 th percentile) and 25 (75 th percentile). Compared to similar schools, the submitted ACT scores are around national average at TROY.
The following table and chart show the changes in ACT scores at Troy University since 2014.
| Year | Composite | English | Math | ||||||
|---|---|---|---|---|---|---|---|---|---|
| 25 th | 50 th | 75 th | 25 th | 50 th | 75 th | 25 th | 50 th | 75 th | |
| 2014-15 | 19 | 23 | 26 | 19 | 23 | 27 | 17 | 21 | 24 |
| 2015-16 | 19 | 23 | 26 | 19 | 23 | 27 | 17 | 21 | 24 |
| 2016-17 | 18 | 21 | 24 | 17 | 21 | 25 | 16 | 20 | 23 |
| 2017-18 | 18 | 22 | 25 | 18 | 22 | 26 | 17 | 21 | 24 |
| 2018-19 | 18 | 21 | 24 | 18 | 22 | 26 | 17 | 20 | 23 |
| 2019-20 | 18 | 21 | 24 | 19 | 23 | 26 | 17 | 21 | 24 |
| 2020-21 | 18 | 22 | 25 | 18 | 22 | 26 | 16 | 20 | 24 |
| 2021-22 | 17 | 21 | 25 | 17 | 21 | 25 | 16 | 20 | 23 |
| 2022-23 | 17 | 20 | 24 | 16 | 21 | 25 | 16 | 18 | 23 |
| 2023-24 | 18 | 21 | 25 | 18 | 21 | 25 | 16 | 19 | 23 |
| Average | 18 | 21 | 25 | 18 | 22 | 26 | 17 | 20 | 24 |
The following table compares SAT score changes from last year between Troy University and similar schools.
| 2024 | 2023 | Change % | |
|---|---|---|---|
| Troy University | 1045 | 1043 | 0.19% |
| University of South Alabama | 1095 | 1100 | -0.45% |
| Georgia Southern University | 1060 | 1095 | -3.20% |
| Georgia State University | 1130 | 1170 | -3.42% |
| University of Arkansas at Little Rock | 1080 | 1100 | -1.82% |
| University of Louisiana at Lafayette | - | 1111 | -100.00% |
Share your experiences and thoughts about Troy University. It will be a great help to applicants and prospective students!